
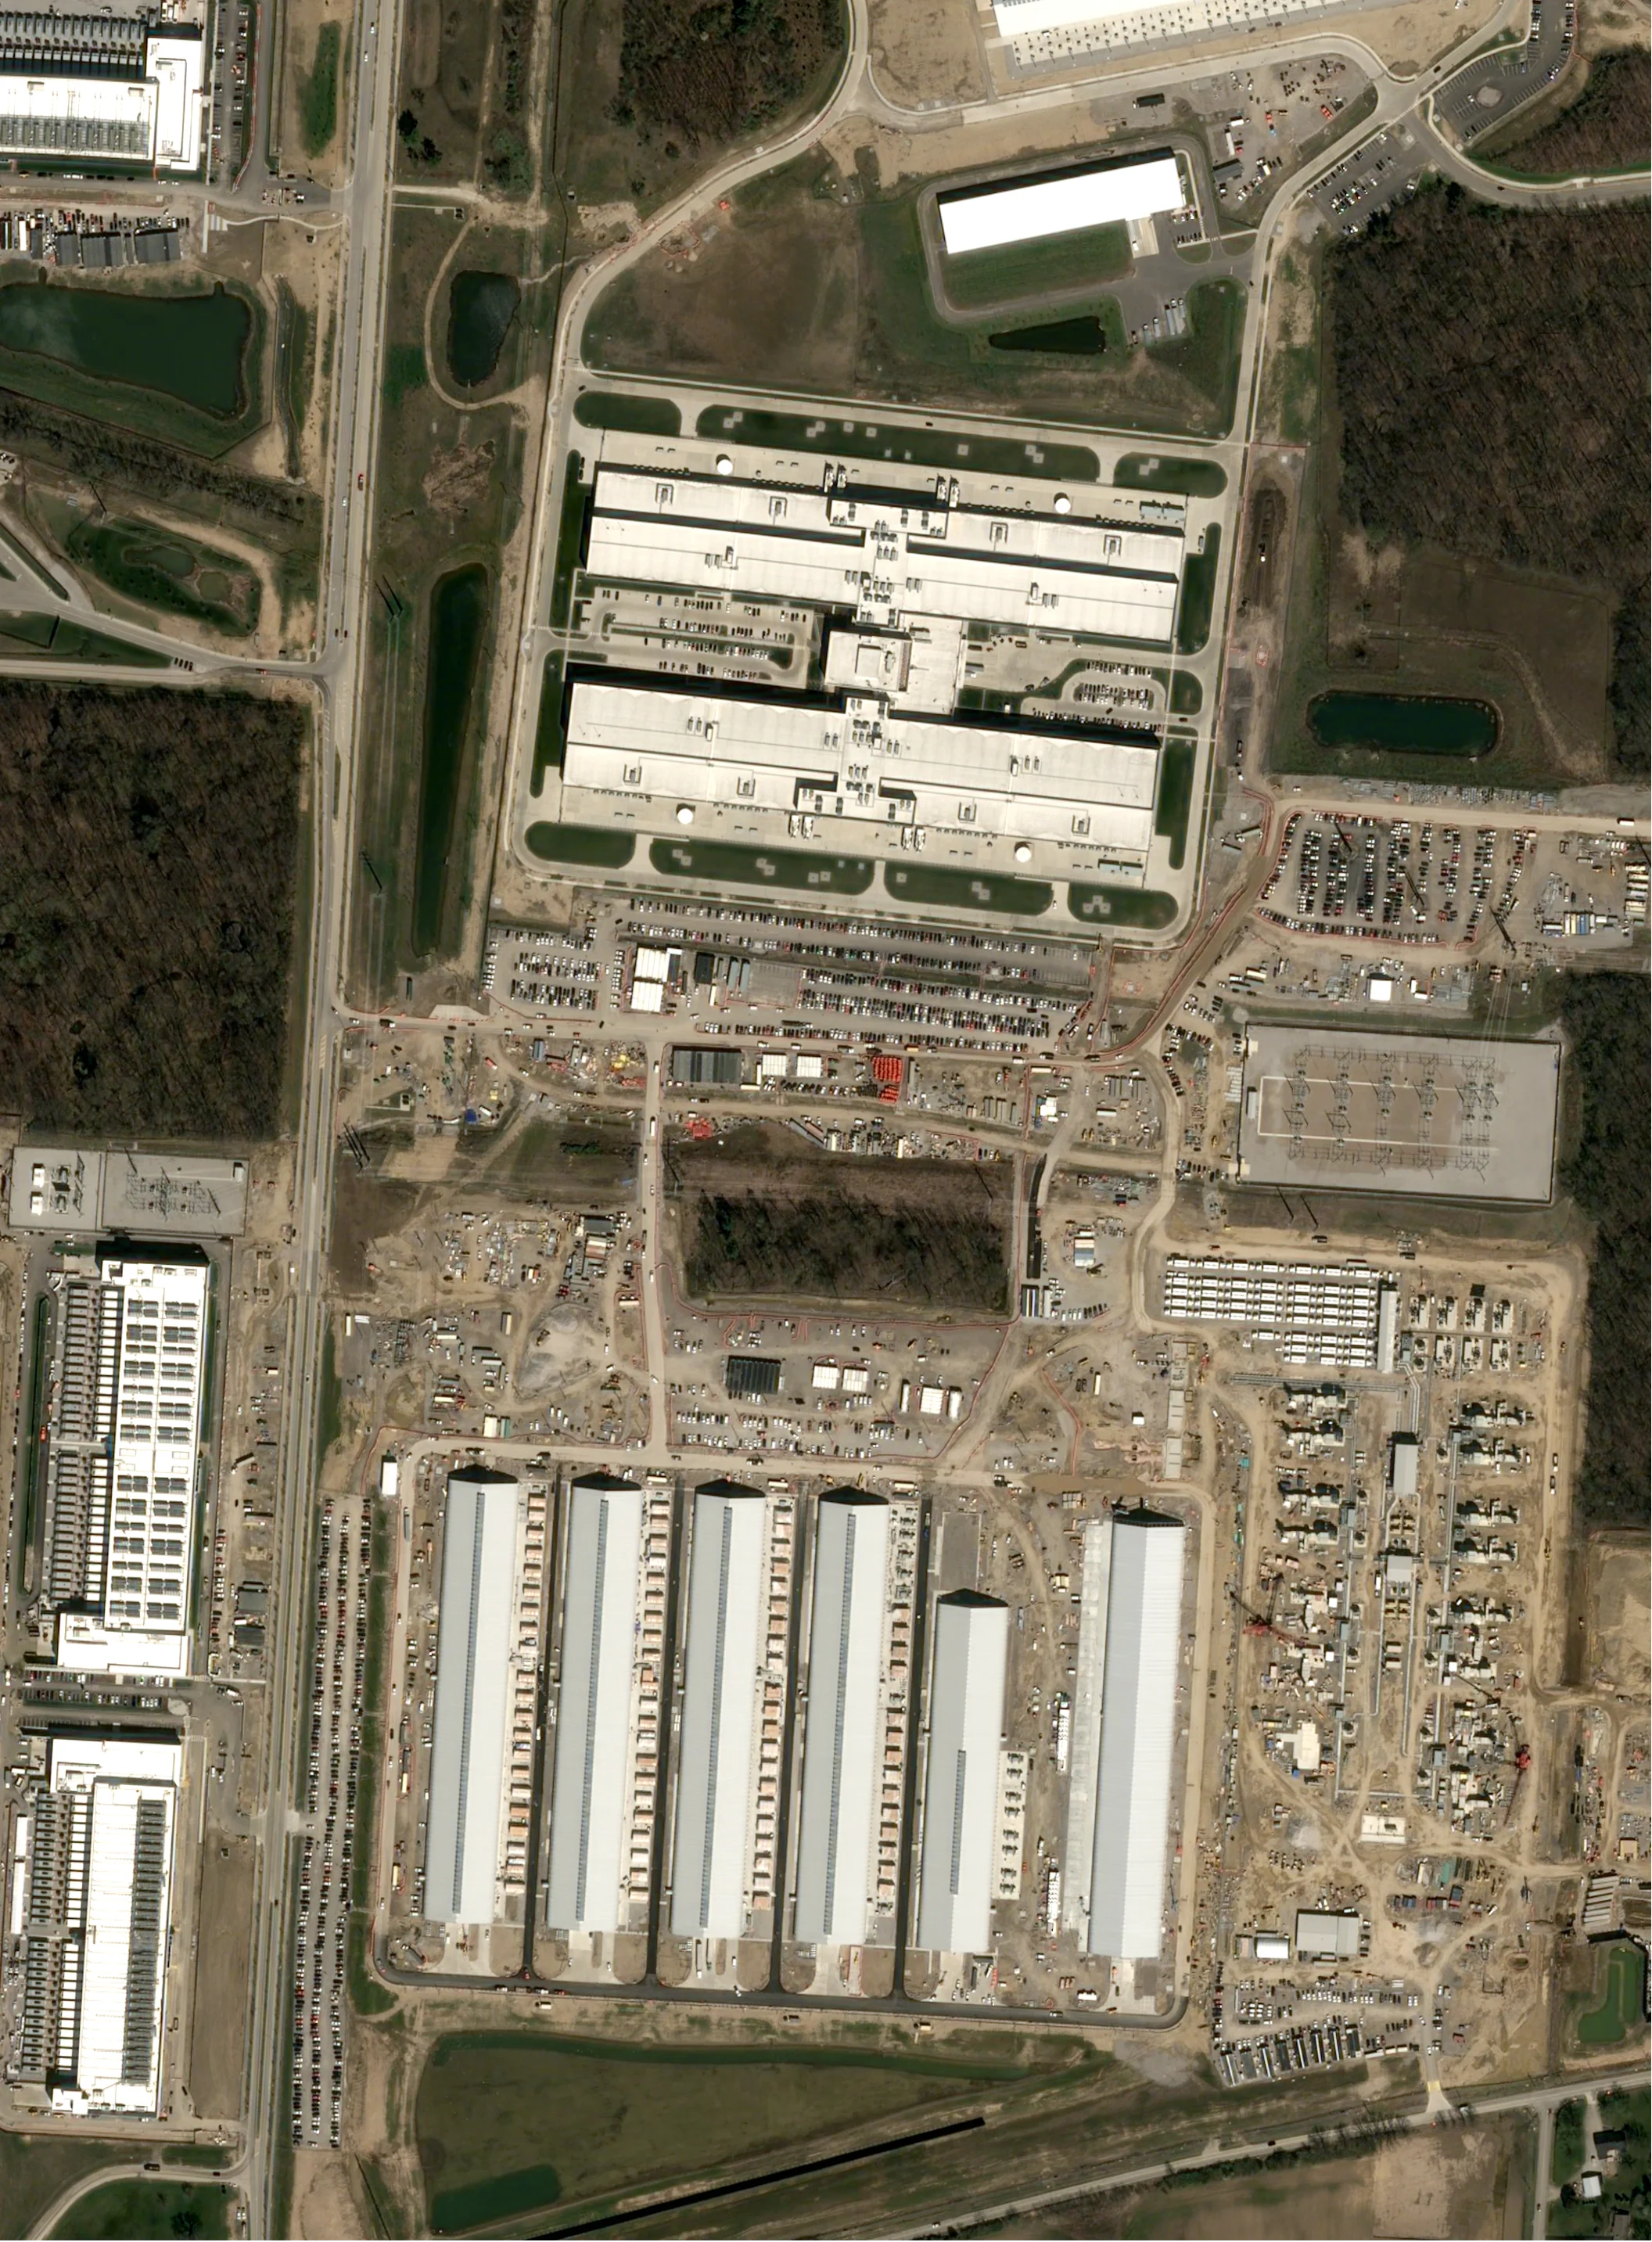
 Airbus, April 2026
Meta New Albany
Meta. Licking County.
Cleanview tracks 278 data centers on 69 campuses in Ohio, many of them AI and hyperscale.
Campuses
Under 200 MW200–999 MW1 GW and up
Updated daily. Last updated November 7, 2026.
Campuses ranked by the power capacity of the buildings operating today.
Airbus, April 2026Meta. Licking County.
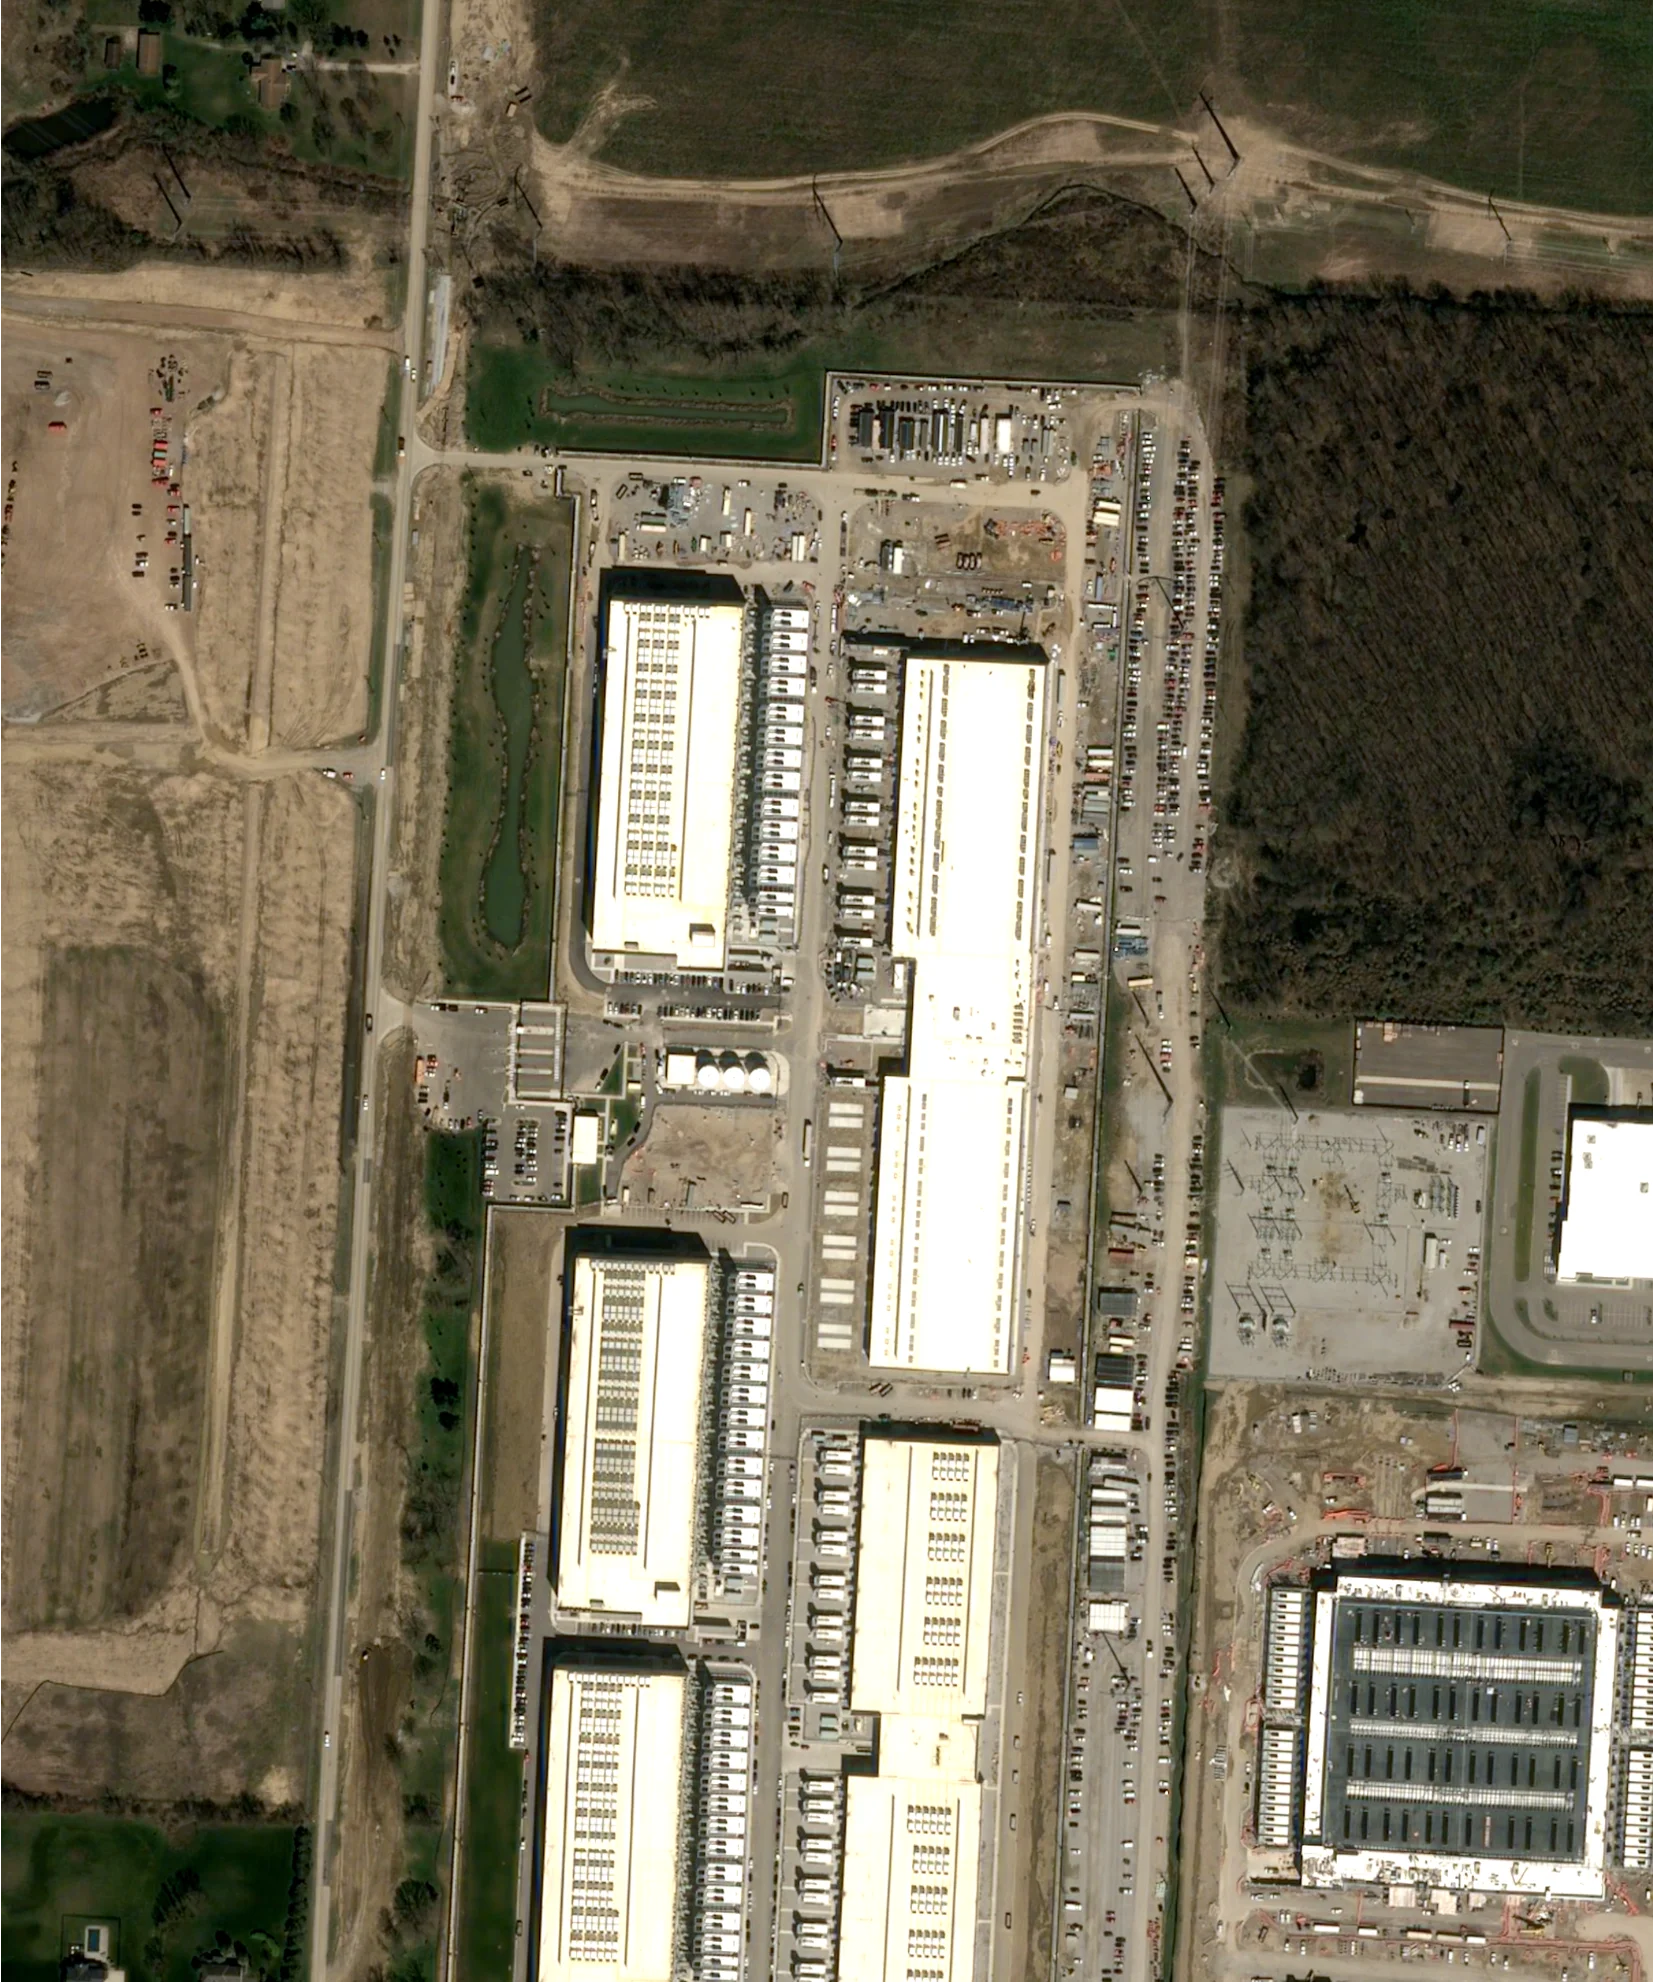 Airbus, April 2026
Amazon. Licking County.
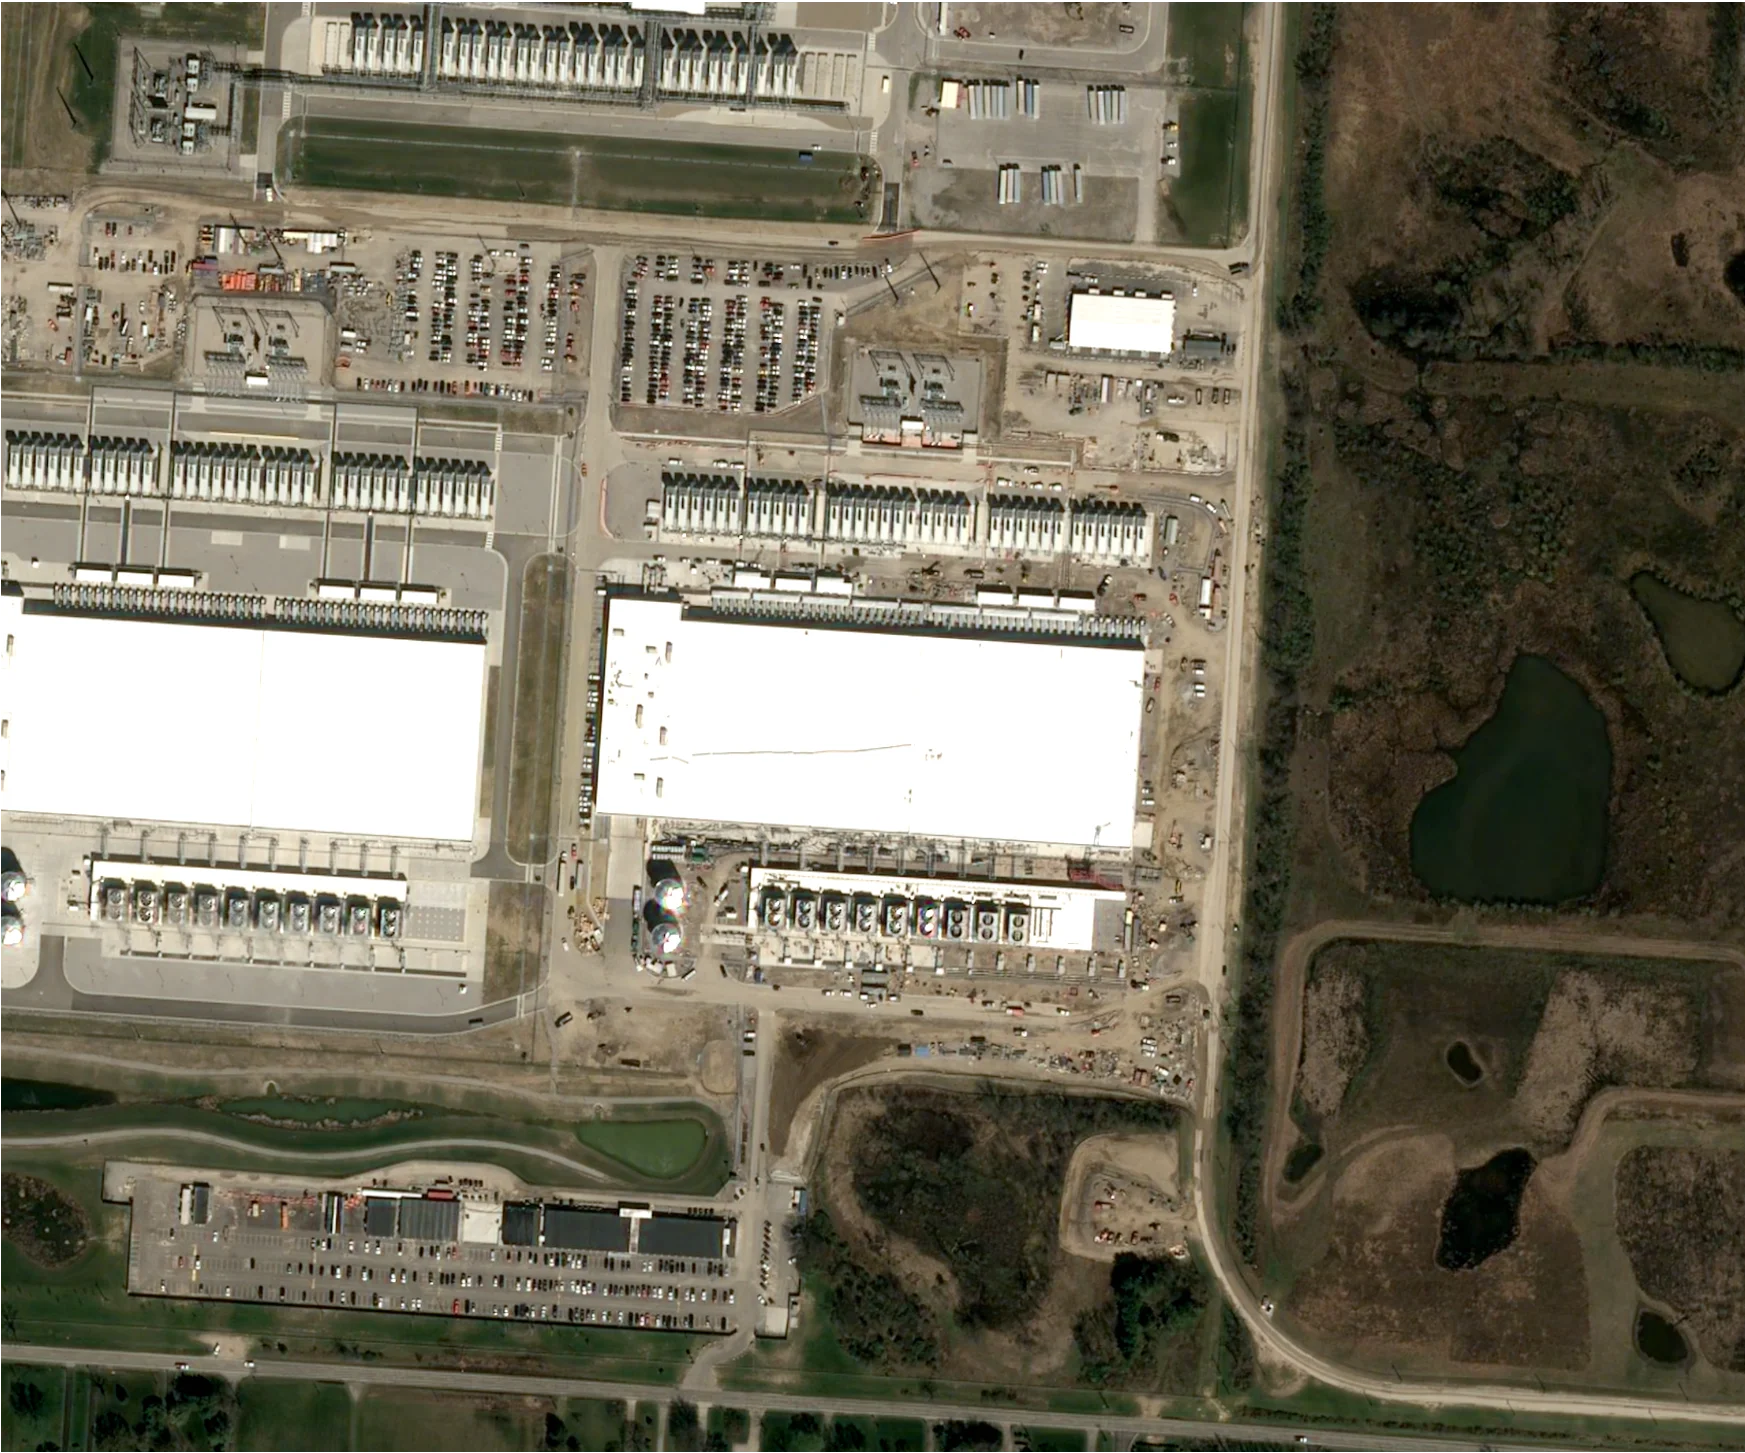 Airbus, April 2026
Google. Licking County.
| # | Campus | Operating capacity |
|---|---|---|
| 1 | Meta New Albany | 637 MW |
| 2 | Google Columbus | 400 MW |
| 3 | AWS New Albany Smith's Mill Road | 386 MW |
| 4 | Google New Albany | 372 MW |
| 5 | AWS New Albany Harrison Road | 308 MW |
| 6 | QTS New Albany | 298 MW |
| 7 | AWS CMH086 Warner Road | 293 MW |
| 8 | AWS CMH091 Cosgray Road | 263 MW |
| 9 | AWS Houchard Road | 208 MW |
| 10 | AWS CMH071 Industrial Parkway | 167 MW |
Get exact power and IT capacity for every building and campus on paid plans
See plansCleanview tracks 57 data center buildings under construction on 21 campuses in Ohio. These are the largest, by power capacity at full build-out.
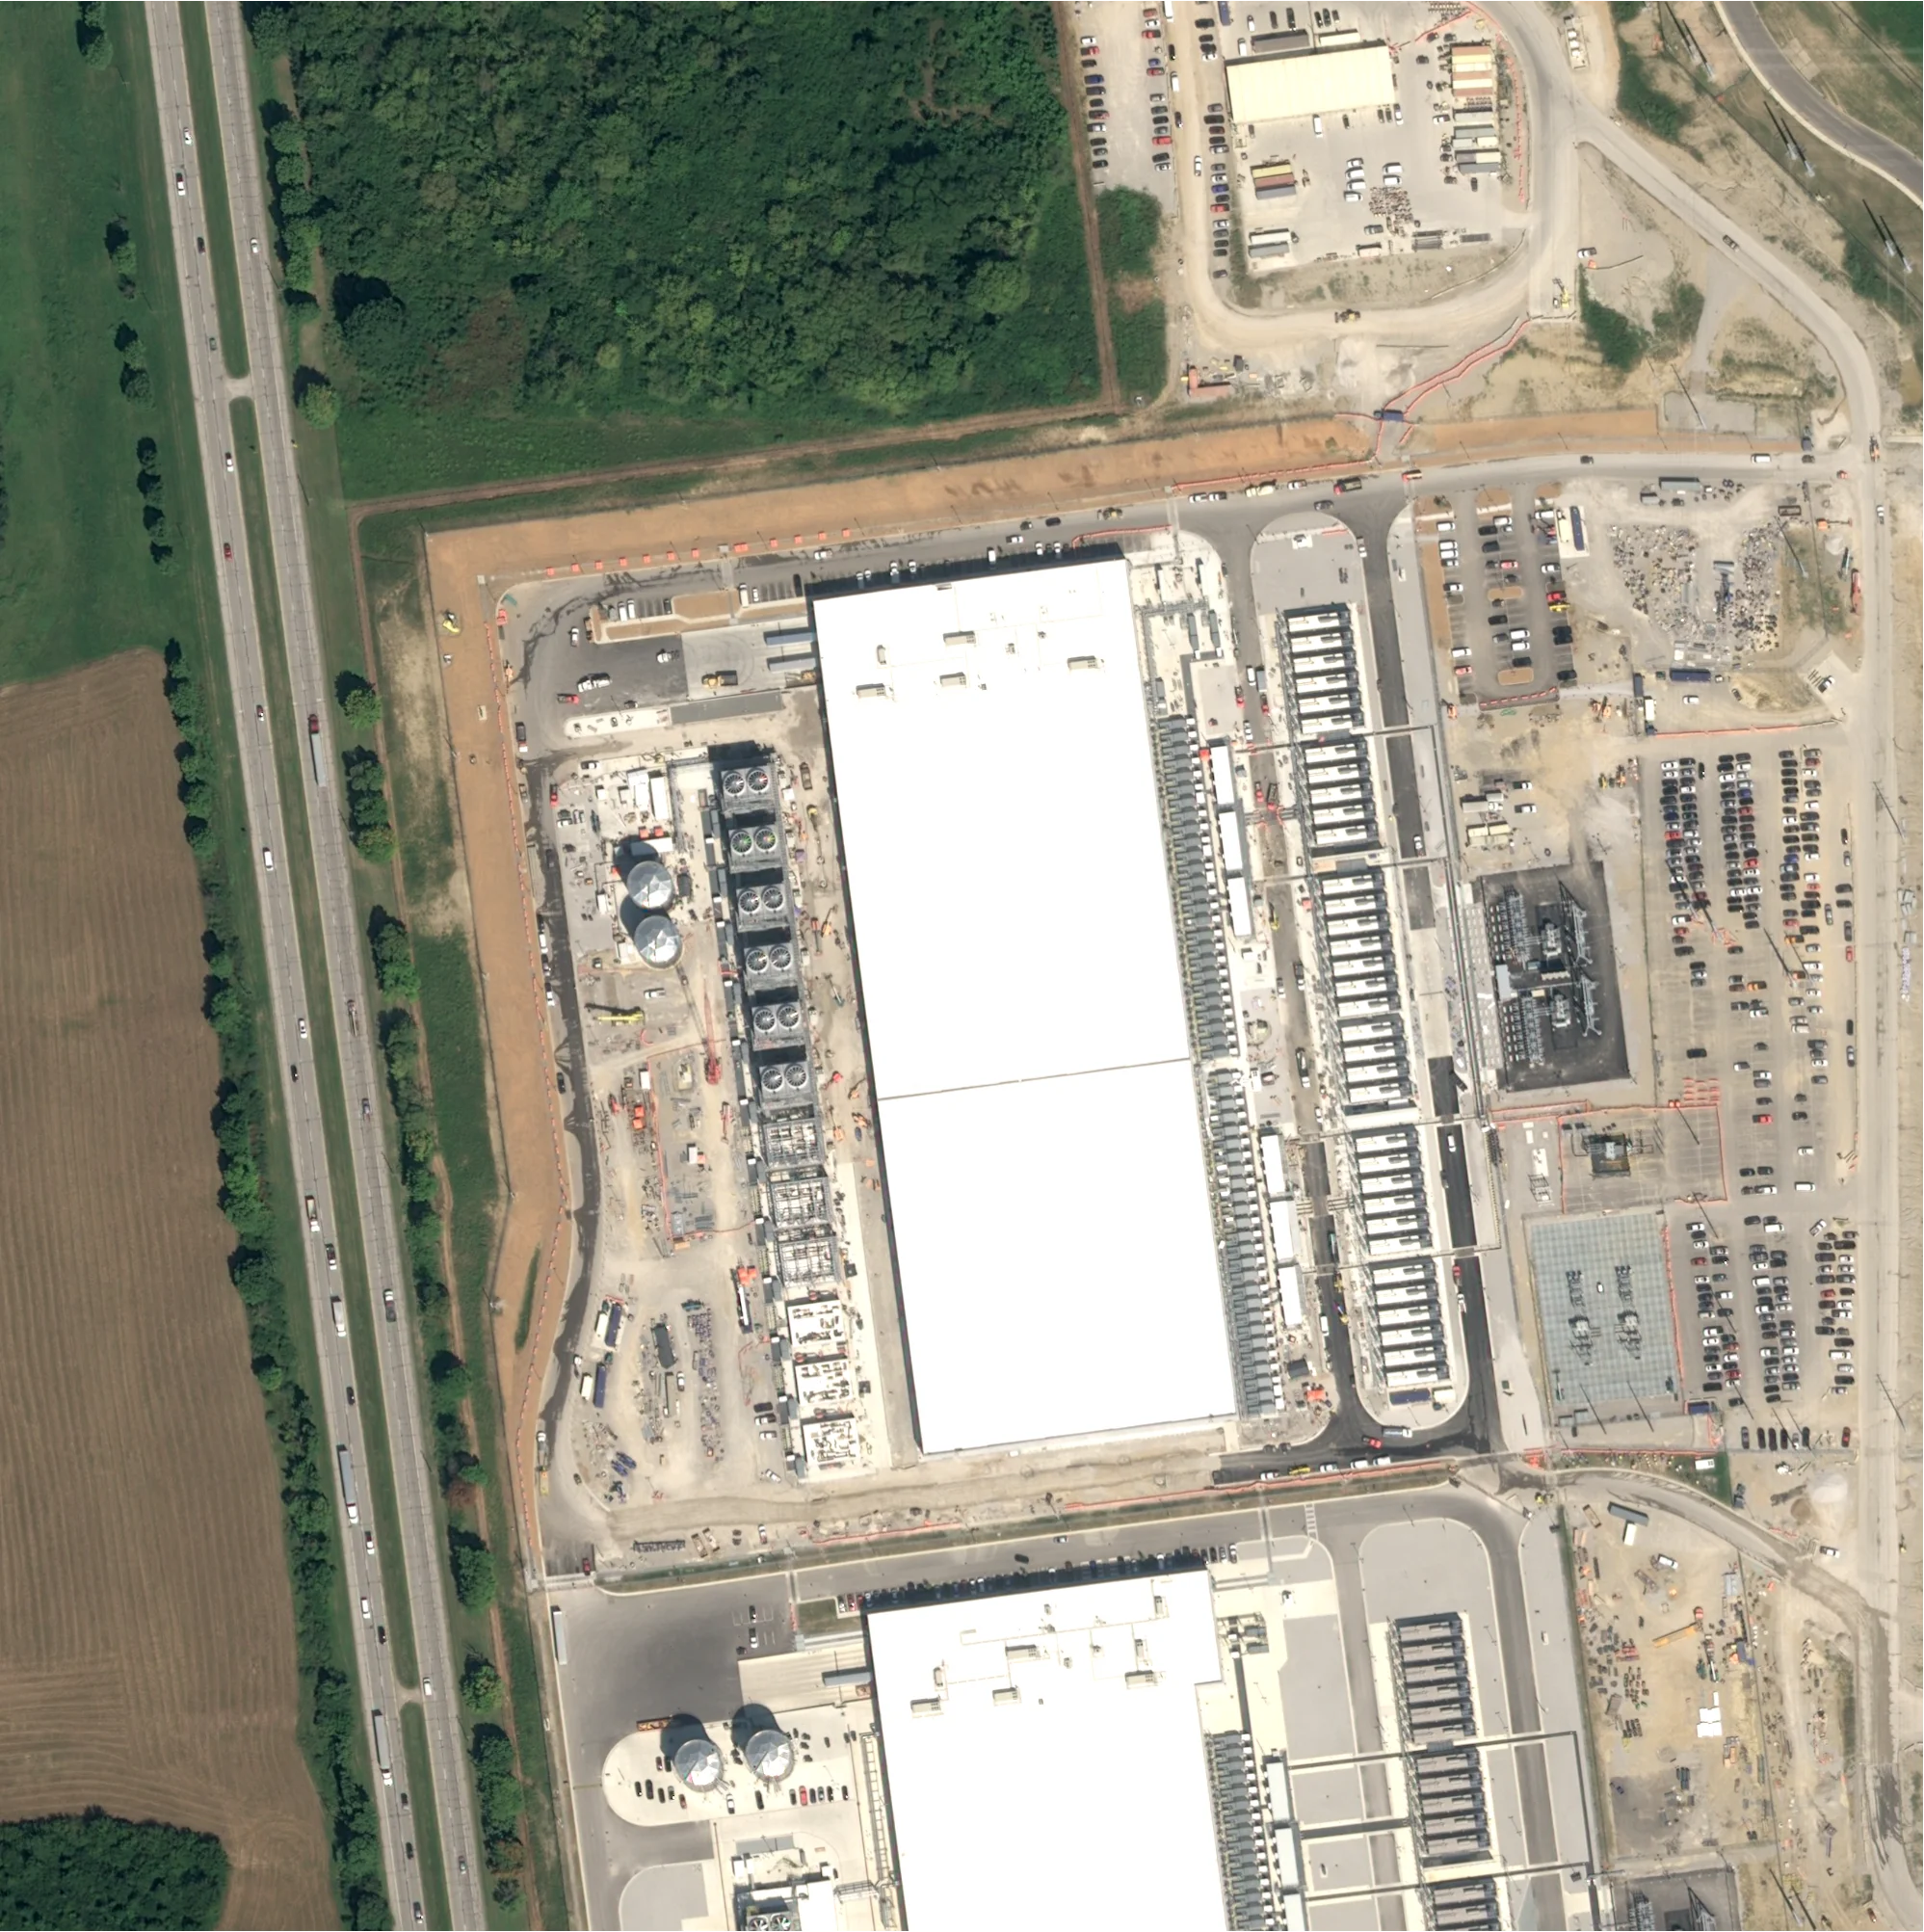 Airbus, September 2026
Google. Franklin County.
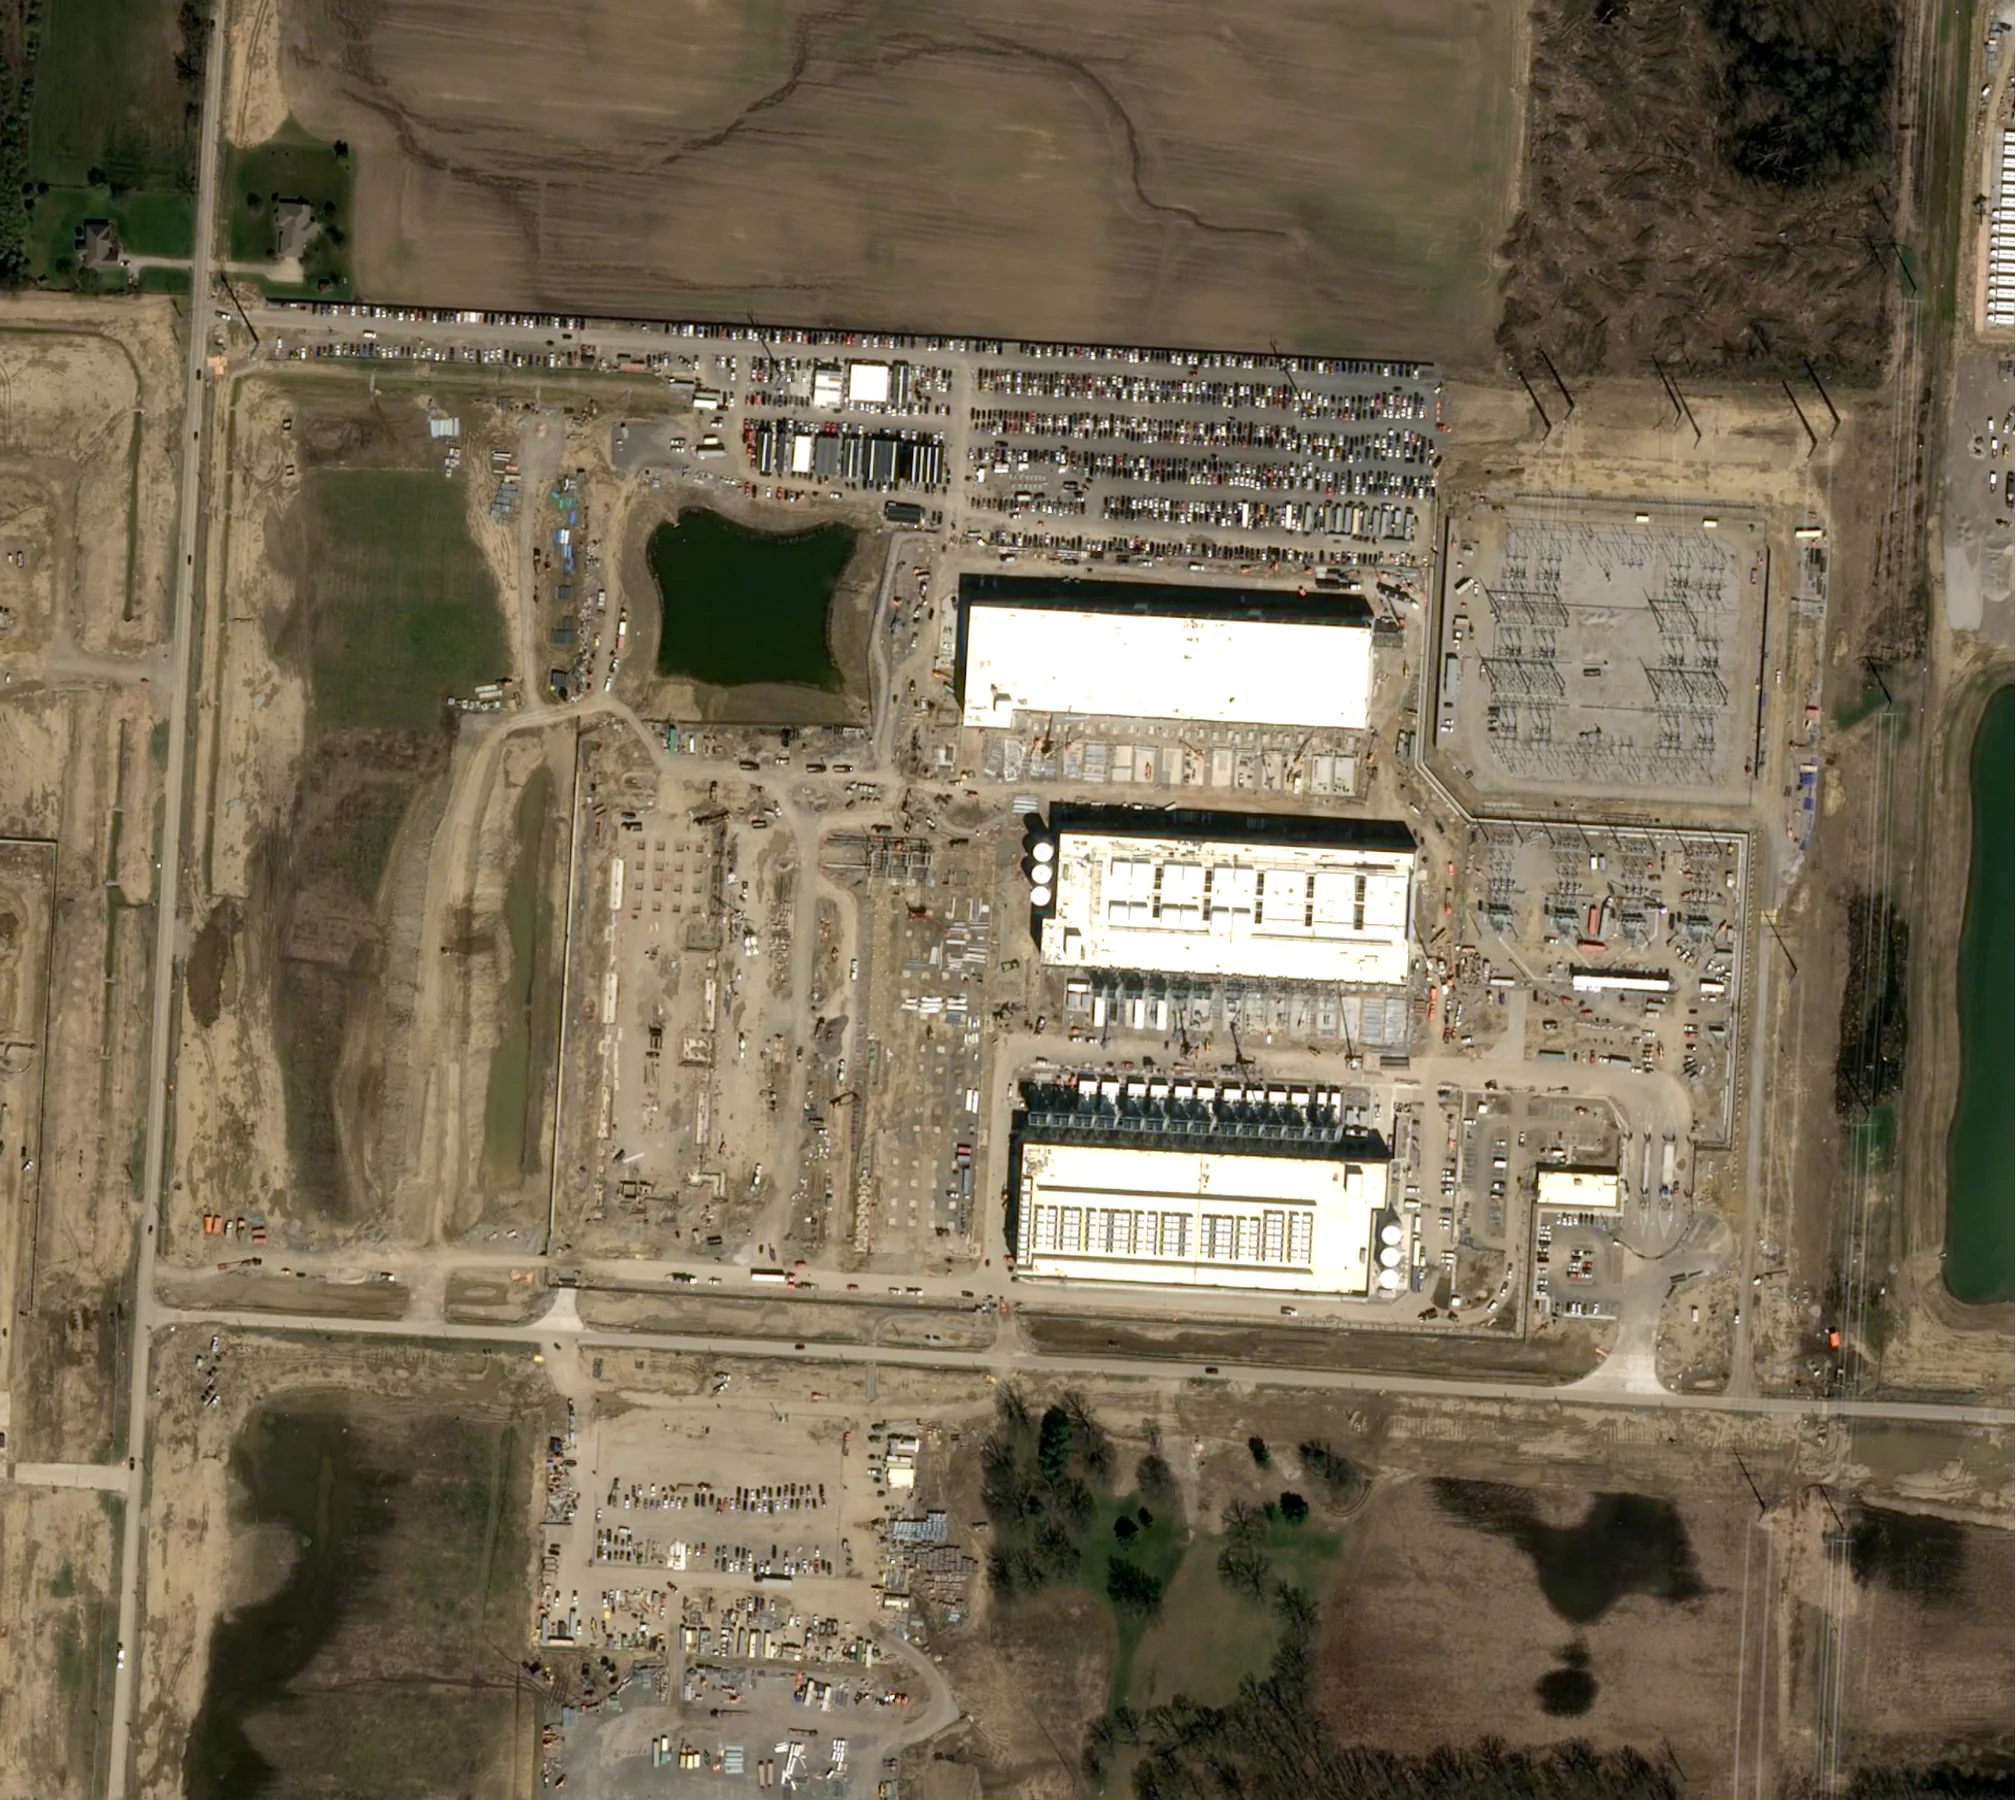 Airbus, April 2026
Amazon. Licking County.
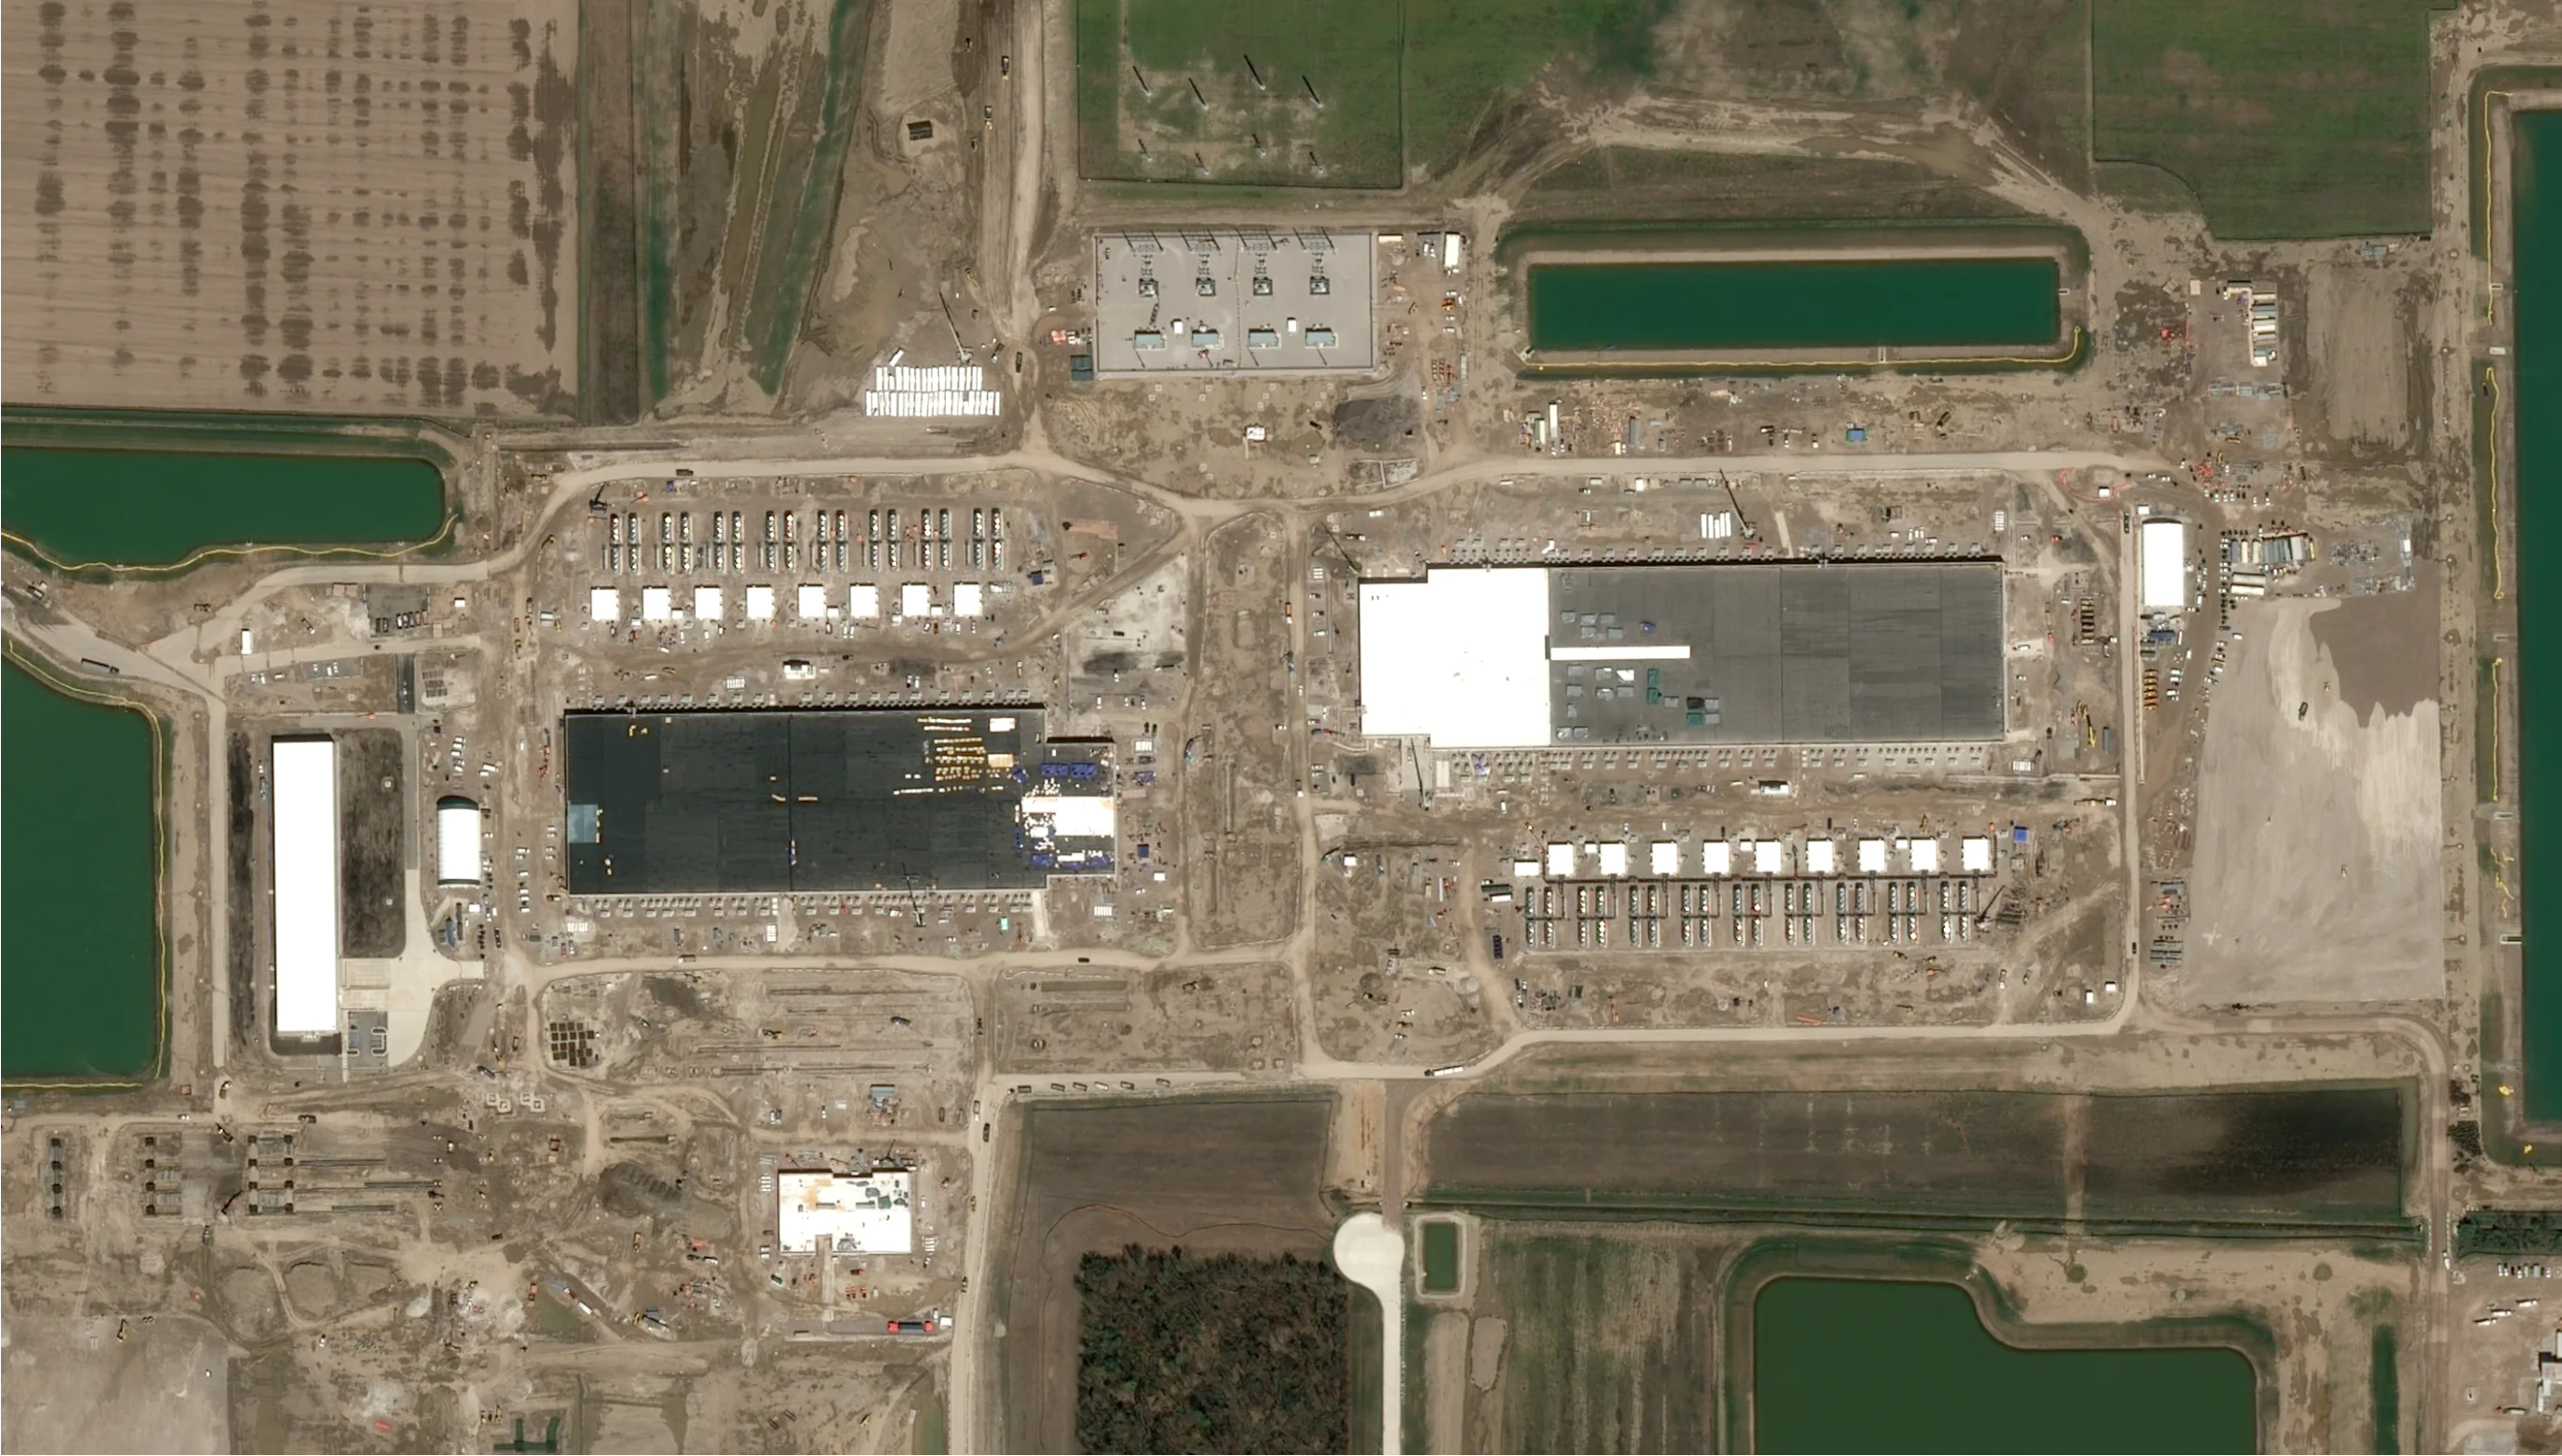 Airbus, April 2026
Meta. Wood County.
| # | Campus | Full build-out |
|---|---|---|
| 1 | AWS Jeffersonville | 1 GW and up |
| 2 | AWS Beech Road | 1 GW and up |
| 3 | Cologix Johnstown | 200–999 MW |
| 4 | AWS Miller Road | 200–999 MW |
| 5 | AWS New Albany Smith's Mill Road | 200–999 MW |
| 6 | Google Columbus | 200–999 MW |
| 7 | 5C Data Centers CMH01 | 200–999 MW |
| 8 | Google New Albany | 200–999 MW |
| 9 | Meta New Albany North | 200–999 MW |
| 10 | Aligned CMH-02 Conesville | 200–999 MW |
Get exact power and IT capacity and expected online dates for every building on paid plans
See plansThere's no government database of data centers. We build ours from public records, one campus at a time, and track every kind: AI and hyperscale campuses, colocation sites, enterprise data centers and crypto mines. We only count individual buildings as data centers, and group them into campuses: one site, usually built in phases.
Each campus starts with a public document: an air permit, a building permit, a rezoning or a utility filing. We record each building's power and IT capacity from them and save every source.
We follow each campus from its first filing through construction, and update it as buildings come online. Most campuses are built in phases, so we track every building.
Satellite images show when crews start grading and when buildings go up. Under construction means work has started on site, not just an announcement.
Or see all data center campuses in the US on one map.


