 Cleanview
Cleanview Research · October 2026
The Geography of Compute
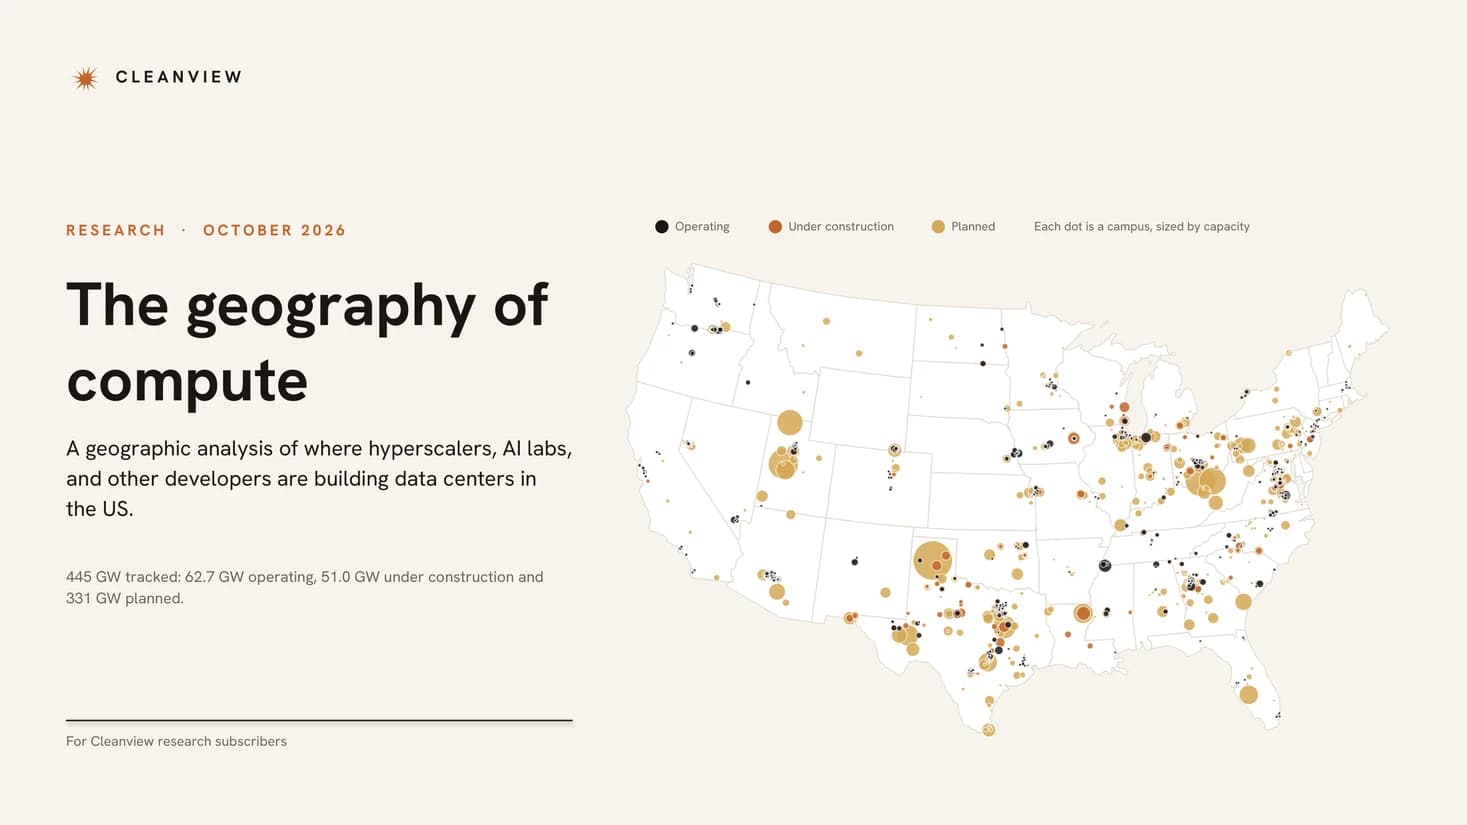
Where hyperscalers, AI labs and other developers are building data centers in the US.
PDF report and Excel data tables · 30 pages · 445 GW of data centers tracked
What's inside
The report and the data behind it
- Operating, under construction and planned data center capacity for all 50 states
- The same breakdown for 482 counties, including the 50 counties with the most capacity
- The 50 largest data center campuses, with county, developer, tenant and end user
- Data center capacity by utility, utility parent company and balancing authority
- An Excel file with all of these tables
- Profiles of Northern Virginia, Columbus and Texas
- Where Amazon, Google, Meta, Microsoft, OpenAI, Anthropic, xAI and neocloud developers are building
- Data center capacity by grid operator, and its distance from high-voltage transmission lines and major gas pipelines
- Data center capacity by 2024 presidential vote, House district, and the Senate and governor's races in November
Contents
- 01Established markets2
- 02New markets6
- 03Who is building9
- 04Trends12
- 05Power13
- 06Politics18
- 07The 2026 midterms20
- 08Appendix: data tables24
30-page PDF report
Excel file of every appendix table
Get the report
Buy this report, or get every report we publish
This report
$4,900one-time
- 30-page PDF report
- Excel data tables: 50 states, 482 counties, the 50 largest campuses, 190 utilities and 45 balancing authorities
- Files delivered immediately after checkout
Research subscription
$18,000per year
- This report and every report we publish
- Quarterly updates and analysis
- Priority access to our research team
Questions
- How is the report delivered?
- After checkout you land on a download page with the PDF and the Excel data tables.
- What is in the data file?
- The report's appendix tables in full: capacity for all 50 states, 482 counties, the 50 largest campuses, 190 utilities, 48 utility parents and 45 balancing authorities, each split into operating, under construction and planned.
- Where does the data come from?
- Cleanview's data center tracker, built from building permits, air permits, utility and regulatory filings, county records and satellite imagery.
- How current is it?
- Capacity is as of October 4, 2026.
Journalists: to interview the author, contact us here.